DW · ACADEMY

Deltawall Academy

Every card shown on its own, with the exact formula behind it, what feeds it, where it stops and how to read it.

Lessons
7
Features
28
Checks
26
Decision tiles
6
00

Token wall

Which graduated Solana tokens deserve a closer look?

2 features
01

Token tile & wall score
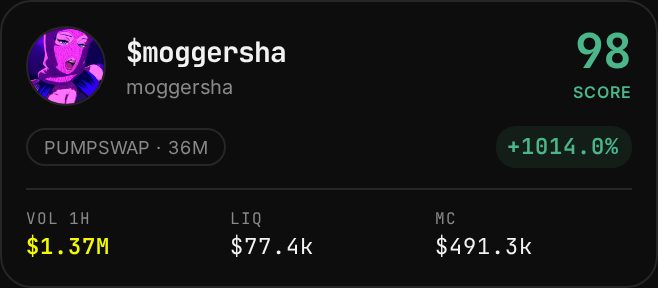
Token tile & wall score card

One tile per graduated token: ticker, venue and age, a 0–100 score, price change, then volume, liquidity and market cap for the chosen window.

Formula
buyBalance = 100 − |buyShare% − 55| × 2.5        weight 35
depth      = (liquidity ÷ MC) ÷ 0.15 × 100       weight 35
tradeSize  = (volume ÷ trades) ÷ $50 × 100       weight 30
score = Σ(part × weight) ÷ Σ(weight of measured parts)
final = min(score, activity cap)
Inputs
Live DEX pair: buys, sells, volume, liquidity and market cap for the selected window.
Limits & edge cases
Each part is clamped 0–100. Missing parts drop out of the divisor instead of counting as zero. Activity caps: volume < $10k/h → max 40; < $25k/h → max 55; < 60 trades/h → max 50; bots > 50% of trades → max 45; liquidity < 10% of MC → max 60; volume fallen below 30% of its 24h hourly average → max 50. The lowest cap wins.
How to read it
This is why a token with $2k volume can no longer show 98. A 55% buy share scores highest: balanced but leaning to buyers.
02

Filters, stats and Fame / Shame

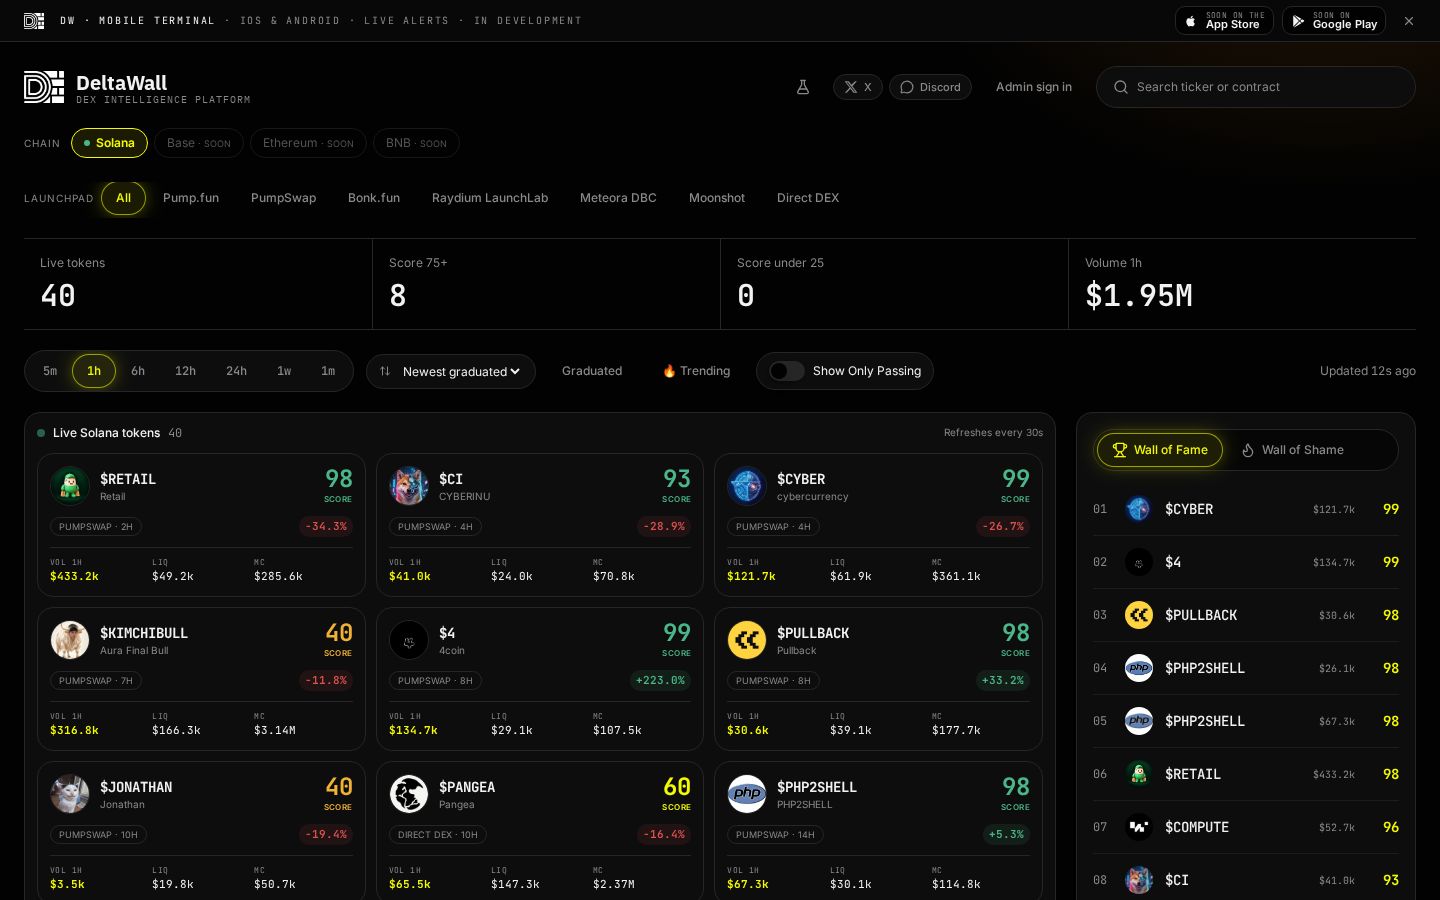
Filters, stats and Fame / Shame card

Chain and launchpad filters, timeframe, Graduated vs Trending, the live stat bar and the highest/lowest scores right now.

Formula
Trending: priceChange(window) > 0  AND  volume(window) > 0
          sort by trades desc, then volume desc
Hidden:   change(6h) ≤ −80%  OR  change(24h) ≤ −80%  OR  volume = 0
Inputs
Same live pair data as the tiles; up to 90 tokens.
Limits & edge cases
Only Solana is live; other chains show SOON and never show placeholder tokens.
How to read it
Fame / Shame rank tokens by score — never individual traders.
OV

Overview cockpit

What is the whole picture in one screen?

6 features
01

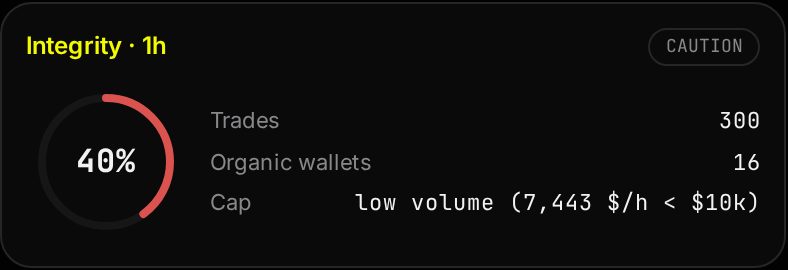
Integrity ring

Integrity ring card

The token's overall score: the average of the four engine scores, then capped by activity.

Formula
integrity = min( mean(E1, E2, E3, E4 measured), activity cap )
Inputs
The four engine scores below plus pair volume, trades and liquidity.
Limits & edge cases
An engine with no measured data is left out of the average. The red note lists every cap that applied.
How to read it
75+ high integrity · 50–74 moderate · 25–49 caution · under 25 high risk.
02

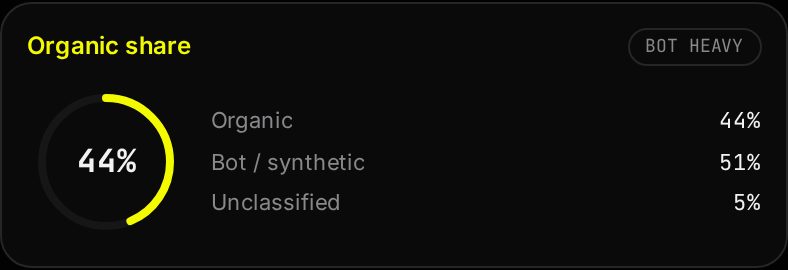
Organic share

Organic share card

Share of dollar volume from wallets that look like real, independent traders.

Formula
organic% = V(organic) ÷ (V(organic)+V(insider)+V(unknown)+V(bot)) × 100
shares rounded so the four add up to exactly 100.0
Inputs
Recent swaps with wallet, side, size and block.
Limits & edge cases
Unknown volume is never counted as organic.
How to read it
Under 50% means most of the volume shown on DEX screeners isn't real demand.
03

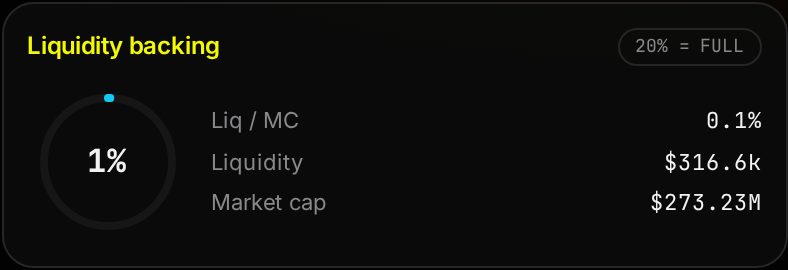
Liquidity backing

Liquidity backing card

How much sellable liquidity stands behind the market cap.

Formula
backing% = liquidity ÷ market cap × 100
ring = min(100, backing% ÷ 20 × 100)   → 20% backing fills the ring
Inputs
Pool liquidity and market cap.
Limits & edge cases
Under 10% also caps the integrity score at 60.
How to read it
$1.6M MC on $40k liquidity (2.5%) means a few sells can move price hard.
04

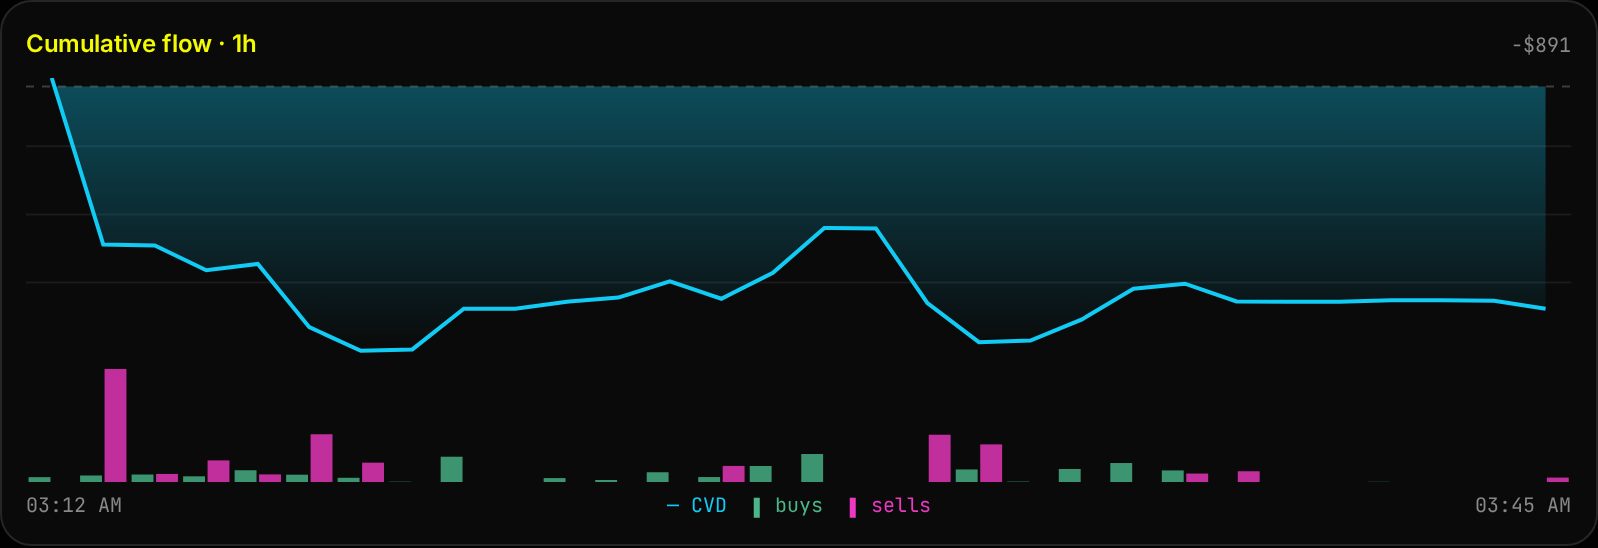
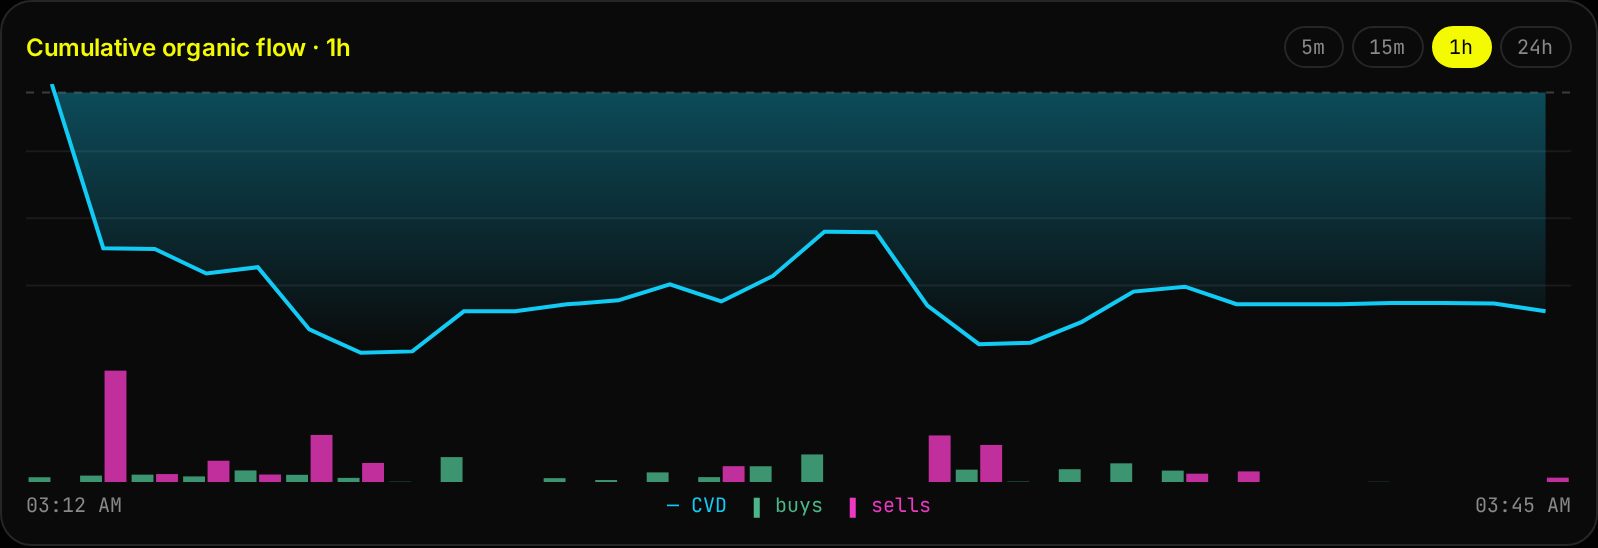
Cumulative flow

Cumulative flow card

Running total of buy dollars minus sell dollars through the window.

Formula
CVD(t) = Σ (+buyUsd or −sellUsd) for every trade up to t
Inputs
Each swap's side and dollar size, in time order.
Limits & edge cases
Follows the 5m / 15m / 1h / 24h buttons. No trades → empty chart, not a flat fake line.
How to read it
Price up while the line falls = the move isn't backed by net buying.
05

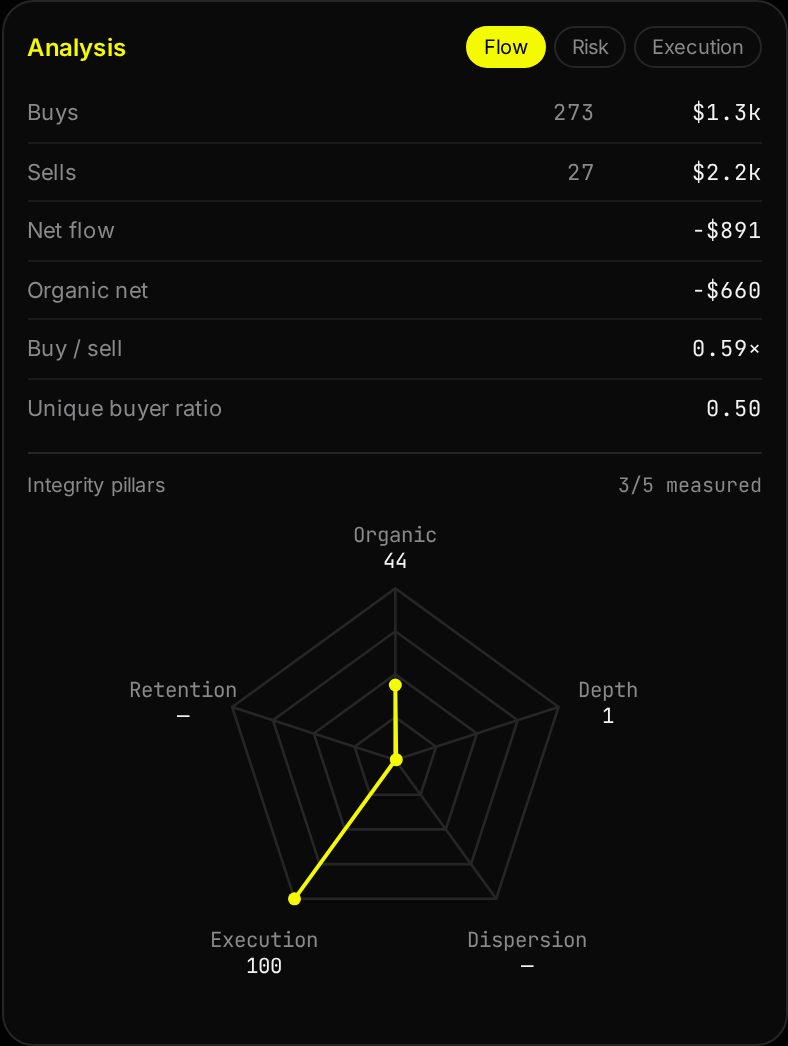
Analysis table & radar

Analysis table & radar card

The measured figures behind the score (Flow / Risk / Execution) and a five-axis radar.

Formula
Organic    = organic%
Depth      = min(100, backing% ÷ 20 × 100)
Dispersion = 100 − top-10 holders %
Execution  = 100 − failed-swap rate% × 2
Retention  = buyers still holding %
Inputs
Same values as the engines.
Limits & edge cases
An unmeasured axis shows — and collapses to the centre.
How to read it
A lopsided shape shows which pillar is dragging the score down.
06

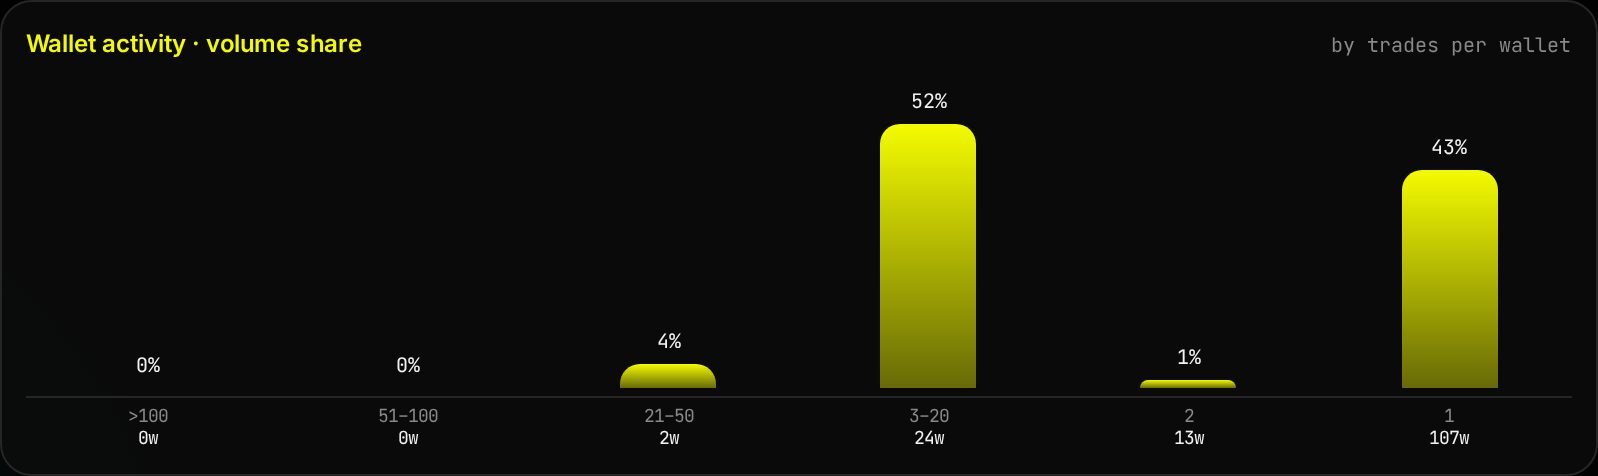
Wallet activity

Wallet activity card

Wallets grouped by how many trades they made: 101+, 51–100, 21–50, 3–20, 2 and 1.

Formula
tier share% = Σ volume of wallets in tier ÷ total volume × 100
each wallet is in exactly one tier
Inputs
Trades grouped by wallet.
Limits & edge cases
Wallet count sits under each column; volume share on top.
How to read it
A few 100+ wallets holding most volume = machines. Many 1–2 trade wallets = broad participation.
01

Clean execution

How much of the volume is real?

4 features
01

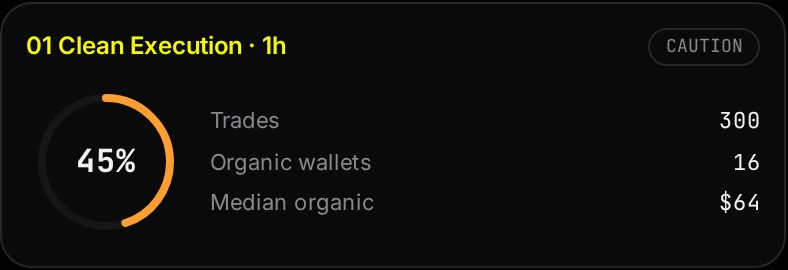
Execution score

Execution score card

Engine 01 score built from organic share, unique buyer ratio and dust.

Formula
E1 = 0.40·organic% + 0.35·min(100, AUBR ÷ 0.70 × 100) + 0.25·(100 − dust trades%)
if bot trades > 50% → E1 = min(E1, 45)
Inputs
Classified swaps for the window.
Limits & edge cases
Parts that can't be measured drop out of the weights.
How to read it
A cap note means the score was held down, whatever the other parts say.
02

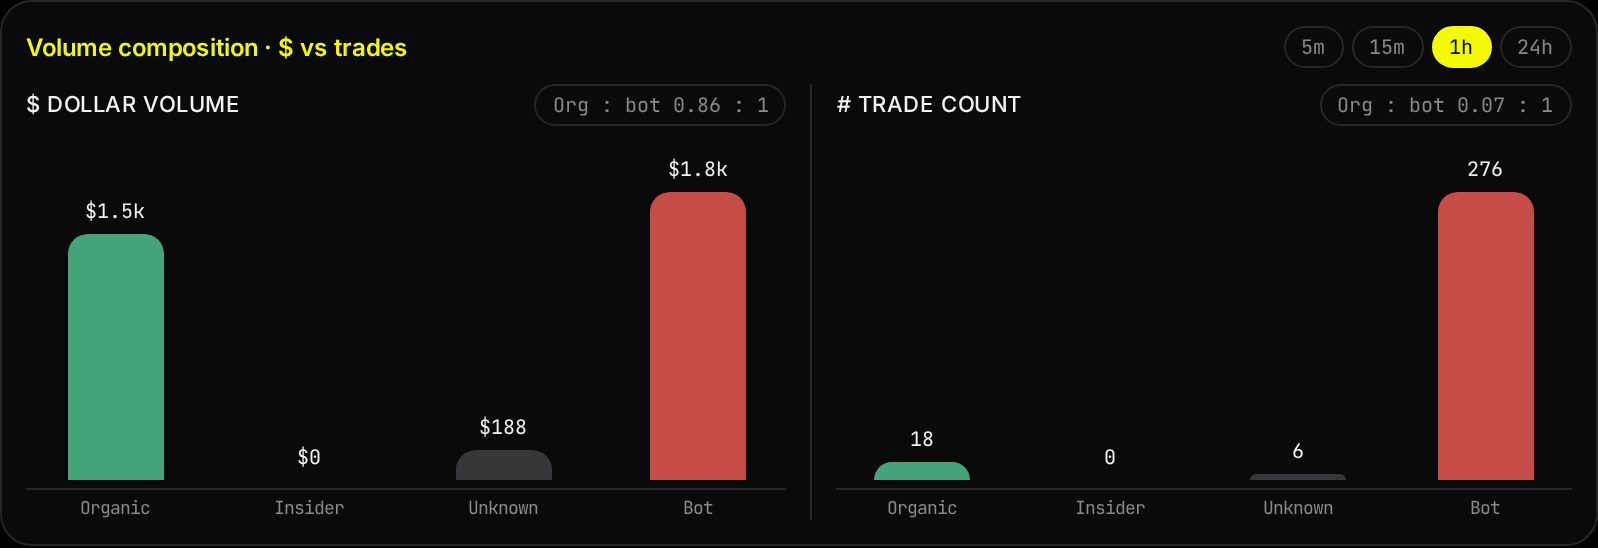
Four-bucket classification

Four-bucket classification card

Every trade lands in exactly one bucket, shown by dollars and by trade count.

Formula
Bot      : trade < $10  OR wallet has ≥2 buys AND ≥2 sells (wash)
           OR wallet bought and sold in the same block (sandwich)
Insider  : wallet funded from a shared SOL source (cluster)
Unknown  : wallet with 4+ trades that isn't wash or sandwich
Organic  : everything else
ratio    = organic ÷ bot   (dollars and trades separately)
Inputs
Wallet, side, size and block of each swap; funding clusters from Engine 04.
Limits & edge cases
Rules run top to bottom; bot wins over insider. No bot side → shows “no bot”, not ∞.
How to read it
Bots are often small in dollars but huge in count — always compare both charts.
03

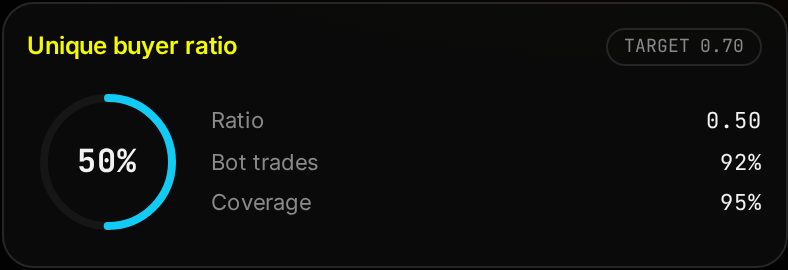
Unique buyer ratio (AUBR)

Unique buyer ratio (AUBR) card

How many organic wallets actually bought.

Formula
AUBR = unique organic buyers ÷ unique organic wallets
score = min(100, AUBR ÷ 0.70 × 100)
Inputs
Organic trades only.
Limits & edge cases
No organic wallets → —.
How to read it
0.70+ means most real wallets are buying. Low means the same wallets are trading back and forth.
04

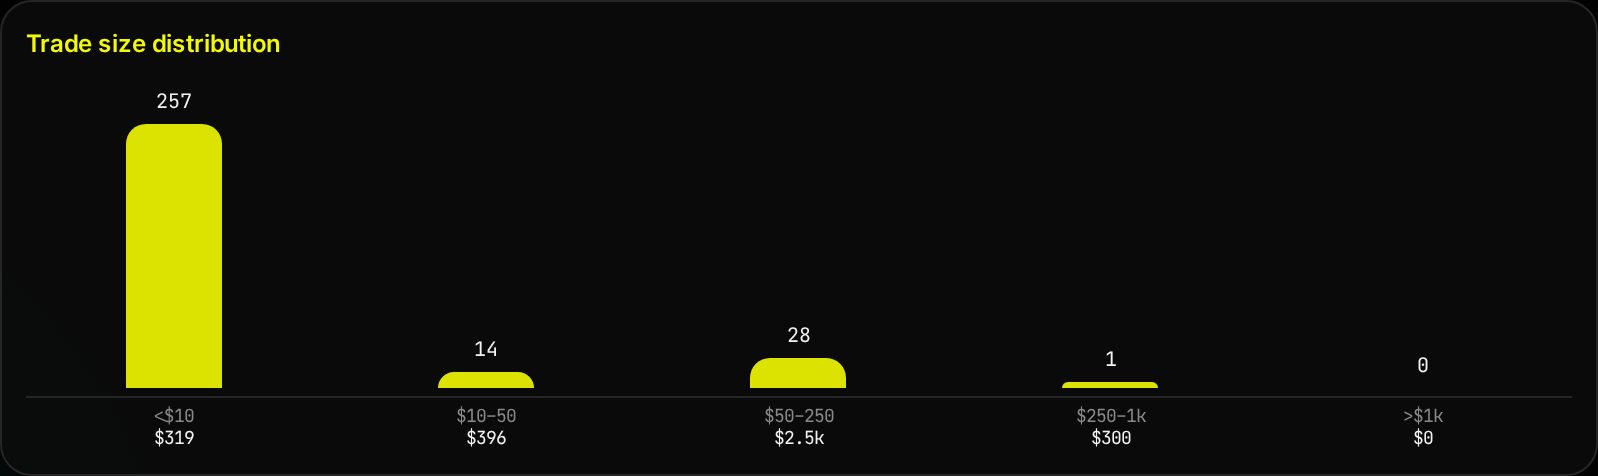
Trade size distribution

Trade size distribution card

Count of trades in size buckets from under $10 to over $1k.

Formula
dust trades% = trades < $10 ÷ all trades × 100
Inputs
Swap dollar sizes.
Limits & edge cases
Trades under $10 are always treated as bot.
How to read it
A tall first column = spam. Healthy demand spreads into the $50–$1k range.
02

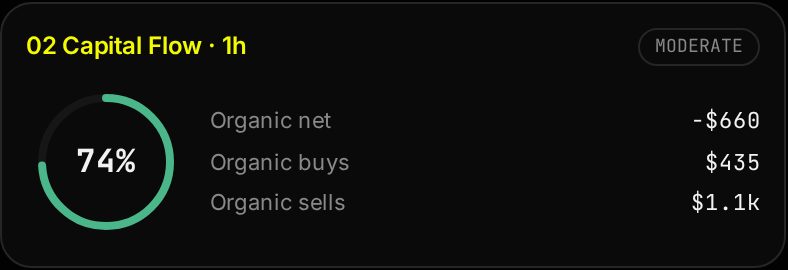
Capital flow

Is money staying in?

4 features
01

Flow score

Flow score card

Engine 02 score from absorption, buy pressure and churn.

Formula
E2 = 0.40·absorption + 0.35·buy pressure + 0.25·(100 − churn%)
Inputs
Organic trades grouped by wallet.
Limits & edge cases
Unmeasured parts drop out.
How to read it
High = organic money is arriving and staying.
02

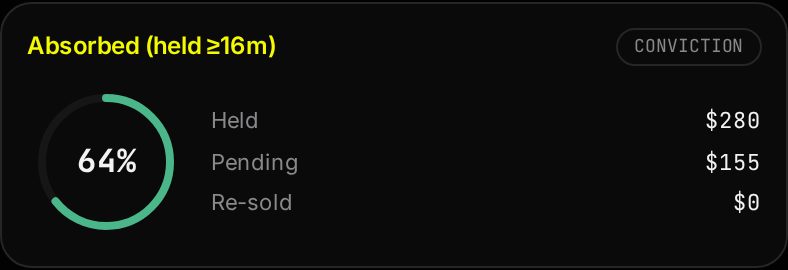
Absorbed & held

Absorbed & held card

Organic buy dollars that are still held vs already re-sold.

Formula
absorption = held ÷ (held + re-sold) × 100
only pending (too new) → 50
Inputs
Each organic buy, checked against later sells by the same wallet.
Limits & edge cases
Pending buys are excluded until there's enough time to judge.
How to read it
Low absorption = buyers flip quickly; the volume doesn't stick.
03

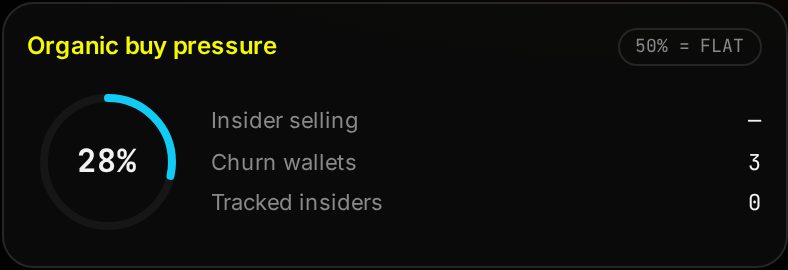
Organic buy pressure

Organic buy pressure card

Share of organic dollars on the buy side.

Formula
buy pressure = organic buy $ ÷ (organic buy $ + organic sell $) × 100
Inputs
Organic trades only.
Limits & edge cases
No organic trades → —.
How to read it
Under 50% while price rises is a warning.
04

Organic flow & churn

Organic flow & churn card

Cumulative organic buy-minus-sell, plus wallets trading both sides.

Formula
churn% = wallets with buys AND sells ÷ all wallets × 100
Inputs
Organic trades in time order.
Limits & edge cases
Follows the window buttons.
How to read it
High churn = the same money circling, not new money.
03

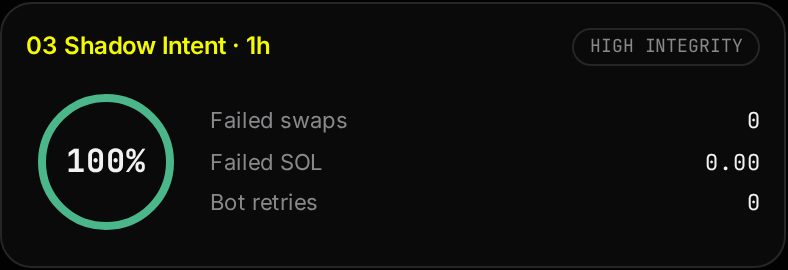
Shadow intent

What did traders try and fail to do?

5 features
01

Shadow intent score

Shadow intent score card

Engine 03 score from failed swaps, exit cost and who is failing.

Formula
E3 = 0.40·(100 − rejection%) + 0.40·exit score + 0.20·organic share
Inputs
On-chain failed swaps (error 0x1771, slippage exceeded) and off-chain Jupiter route simulations for exit depth. Quotes never fail; only executed transactions do.
Limits & edge cases
Unmeasured parts drop out.
How to read it
Low = people can't get trades through or exits are expensive.
02

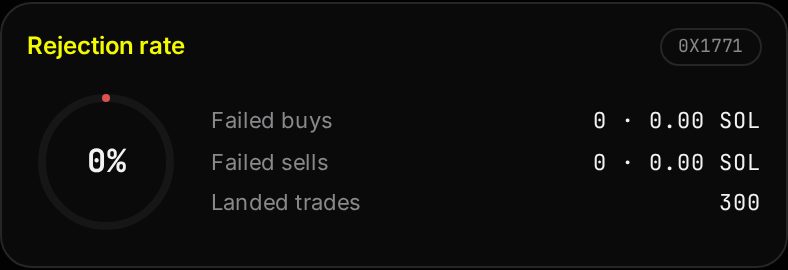
Rejection rate

Rejection rate card

Share of swap attempts that failed.

Formula
rejection% = failed ÷ (failed + successful trades) × 100
Inputs
Failed transactions on the pool, split slippage / gas / other.
Limits & edge cases
Nothing indexed → —, never 0%.
How to read it
Many failed sells = people struggling to exit.
03

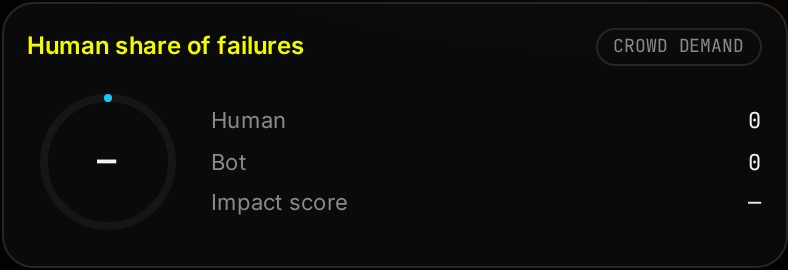
Organic share of failures

Organic share of failures card

Failures from real wallets vs bot retries.

Formula
organic share = organic failures ÷ (organic + bot-retry failures) × 100
Inputs
Failed swaps with their wallets.
Limits & edge cases
Bot retries are counted separately.
How to read it
Organic = signers not flagged as rapid retries (≥3 failures/min); we cannot verify humans. Organic failures hint at real demand or panic; bot retries are noise.
04

Exit price impact

Exit price impact card

Live Jupiter quote: how much price moves if you sell $1k, $5k, $10k.

Formula
exit score = 100 − average impact% × 15   (clamped 0–100)
Inputs
Live Jupiter quotes.
Limits & edge cases
Check limit: $10k sell ≤ 15% impact.
How to read it
About 6.7% average impact already scores zero.
05

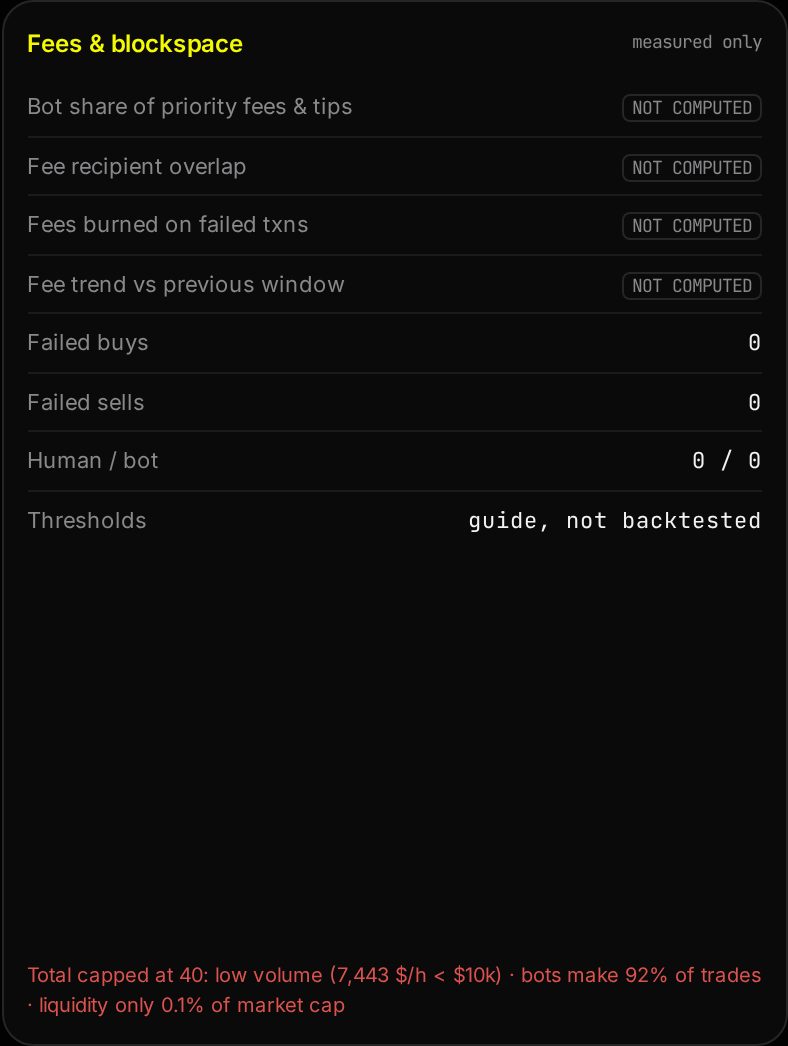
Fees & blockspace

Fees & blockspace card

Priority fees and tips — who pays to get in first.

Formula
bot fee share = bot fees ÷ all fees          avoid > 70%
recipient overlap = shared recipients ÷ all    avoid > 25%
burned = fees on failed txns ÷ all fees        avoid > 20%
caution starts at 75% of each limit
Inputs
Parsed Solana transactions.
Limits & edge cases
Can't compute → “not computed”, never 0%. Limits are guides, not backtested.
How to read it
Rising fees can mean bot competition, not demand.
04

Distribution

Who owns the supply?

4 features
01

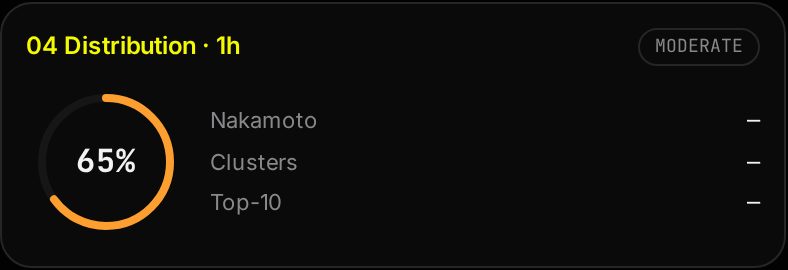
Distribution score

Distribution score card

Engine 04 score from retention, buyer concentration and holder spread.

Formula
E4 = 0.30·retention + 0.30·top-5 score + 0.40·spread
spread = mean( min(100, Nakamoto × 10), 100 − cluster supply% × 2 )
Inputs
Holders, funding clusters, window buyers.
Limits & edge cases
Unmeasured parts drop out.
How to read it
Nakamoto = fewest wallets that together hold over half the supply.
02

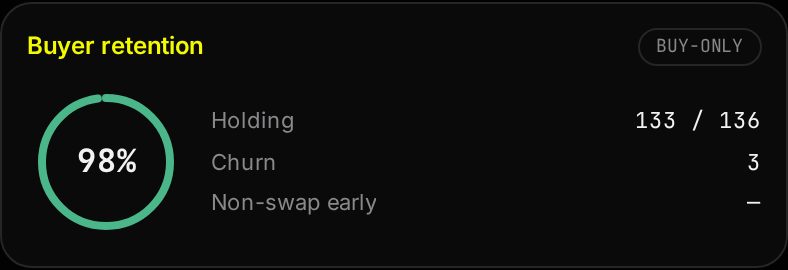
Buyer retention

Buyer retention card

Window buyers still holding.

Formula
retention% = buyers who never sold ÷ all buyers × 100
Inputs
Trades grouped by wallet.
Limits & edge cases
Check limit: early buyers ≥ 30% still holding.
How to read it
Low retention = buyers are using the token to flip.
03

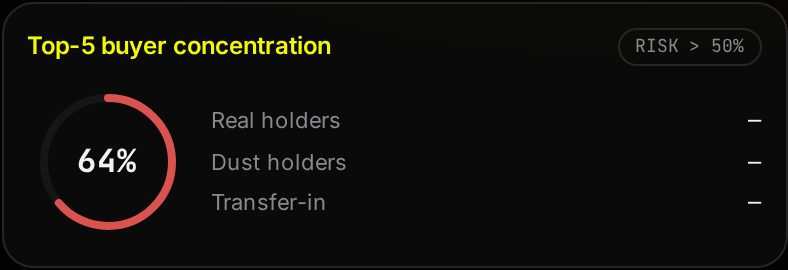
Top-5 buyer concentration

Top-5 buyer concentration card

Share of buy dollars from the five biggest buyers.

Formula
top5% = Σ top-5 buy $ ÷ all buy $ × 100
score = 100 − (top5% − 30) ÷ 50 × 100   (30% → 100, 80% → 0)
Inputs
Buy trades by wallet.
Limits & edge cases
No buys → —.
How to read it
Over 50% means a handful of wallets are the market.
04

Supply split & holders

Supply split & holders card

Real vs dust holders by supply, transfer-only wallets and exchange deposits.

Formula
cluster supply% = Σ supply of wallets sharing a funding source
flag when any cluster > 10%
Inputs
Holder balances, SOL funding sources, transfers.
Limits & edge cases
Transfers show tokens and % of supply — never added to trading volume.
How to read it
A big holder sending to an exchange is a stronger exit signal than a small DEX sell.
CK

Checks & decision strip

Does it pass the hard limits?

3 features
01

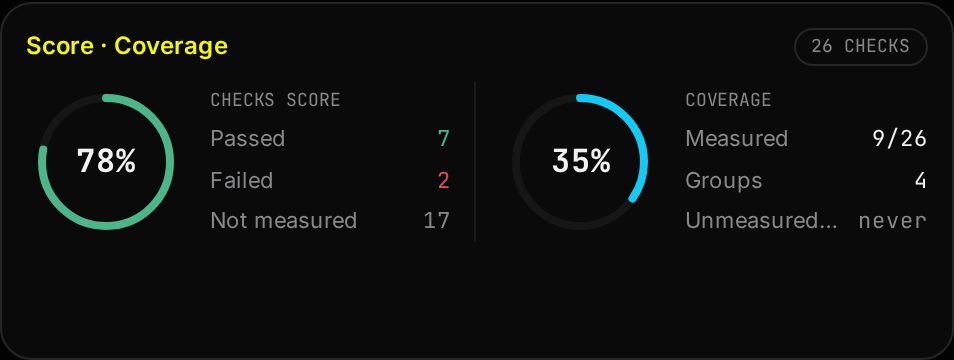
Score · Coverage

Score · Coverage card

Left: share of measured checks passed. Right: how many checks had data.

Formula
score% = passed ÷ (passed + failed) × 100
coverage = measured ÷ 26
Inputs
All 26 checks.
Limits & edge cases
Unmeasured checks never count as passed.
How to read it
89% on 9 of 26 checks is far weaker evidence than 89% on 24.
02

Decision strip

Decision strip card

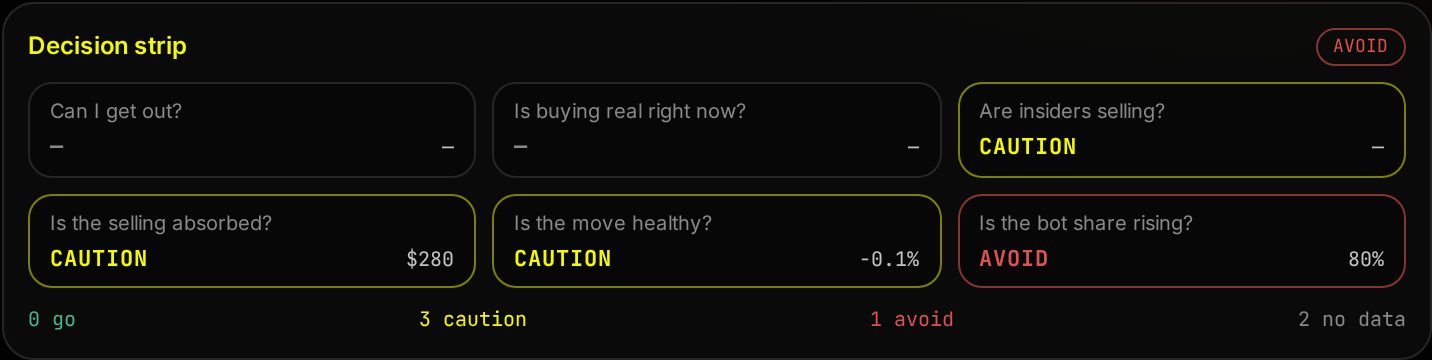
Six tiles: liquidity/exit, net flow, real buyers, bot share, concentration, move health.

Formula
bot share = max(bot $ share, bot trade share)
GO needs ≥ 3 real buyers, bot share ≤ 50%, non-negative flow
verdict = AVOID if any tile is AVOID
Inputs
Same measured values as the engines.
Limits & edge cases
No data → no data, never GO.
How to read it
One AVOID tile outweighs a high score.
03

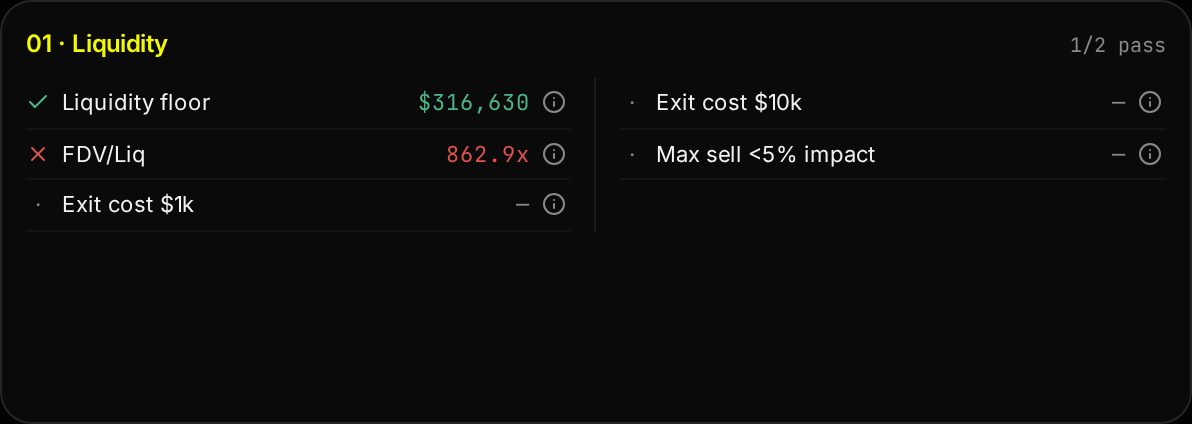
Check boxes

Check boxes card

26 checks in Liquidity, Demand, Safety and Ownership. Each row: status, name, value, limit, ⓘ reason.

Formula
Liquidity ≥ $10,000
Exit cost of $10k ≤ 15%
Early buyer retention ≥ 30%
Bot share ≤ 50%
Inputs
Live pool, quotes, trades and holders.
Limits & edge cases
Limits are guides, not backtested, not advice.
How to read it
Tap ⓘ on any row for why that limit exists.
Ground rules
apply everywhere
Real data only
No sample or invented numbers anywhere.
— means not measured
An empty value never passes a check or adds to a score.
Rules, not AI guesses
Scores come from fixed, tested formulas.
No wallet connection
Deltawall never asks for your wallet.

Screenshots are live captures; numbers in them change with the market. Analytics only, not financial advice. Read the policies.